Tuesday, December 19, 2017

Our 2017 Christmas Letter


 Merry Christmas and an 
outrageously Happy New Year!


Who said life begins at 75?

Offhand, I can’t think of anyone that nutty.

Except me.

I’m probably the first, but I’ll paraphrase: “The rest of our lives began at 75.”

Trite but true.

But there is an element of best in all of this. We appreciate how good we are to each other; how much we appreciate each other. How we still bring nice surprises each day. And we are each other’s best travel companion.

Speaking of travel, and you knew I would, we spent a Spring month in Baja; a two-week cruise up the Bay of Cortez was sandwiched between two very relaxing four-day stays in Cabo San Lucas. Among many highlights was Alice petting a gray whale calf while its mother chaperoned, all the while me dipping a GoPro in the water for whale eyeball video.


In August we went to storied Mendocino (and stayed in the Hill House Inn, featured in Murder She Wrote, which we never watched) for a Writers’ Conference. The highlight was when Alice gave a two-minute pitch of her book, The Lady With Balls, that was so well received that she now has an agent, and will be published in July 2019 by Cypress House in Fort Bragg, Alice’s reward for five years of diligent composing and revising.

There is no way to adequately describe how hard Alice worked and is working on completing her memoir. Along the way she went from an avid student of writing, to painstakingly applying what she learned to crafting over 300 pages detailing her journey into and through the male-dominated garbage recycling industry. It’s an Only in America story - poignant, humorous, heart warming, uplifting – Alice is already planning the audio book, and further down the line, which actress should portray her in the movie.

I plan to make good on my threat of publishing my coming-of-age memoir of growing up in Point Arena in the 1950s. Look in bookstores next year under Ancient California History. Also in the works, It Ain’t Necessarily So, my opus magnum totally debunking the myth of human-caused global warming/climate change/weird weather, covering the last million years of climate change with a concentration on the past 10,000 years since the end of the Ice Age. Look for it in bookstores where the black-clad crowd is chanting to have it burned.

Alice is a good sport, and good company. In late September we went to a reunion in Albuquerque of my old unit, the 81st Tactical Fighter Wing, Royal Air Force bases Bentwaters and Woodbridge, Suffolk County, United Kingdom, where I served my best five-year period (1970-1975) in the Air Force as the base’s Budget Officer. We’re a bit older, our numbers are shrinking, but a great time was had by all. I was stationed at Bentwaters as the Viet Nam War ground down, in the darkest depths of the Cold War. Our 72 F-4 D and E fighter-bombers primarily were tasked with stopping the Soviets and Warsaw Pact tanks in the Fulda Gap on their way to crossing the Rhine, with tactical nukes.


RAF Bentwaters reunion friends with a B-52, almost as old as us and still going strong - just like us!

We already have travels planned well into 2019: next year April in Japan, then a two-week Fall Colors cruise, Canada and New England, with Alice’s Reseda high school reunion group in September. May 2019 will find us on a 27-day Grand European Sojourn cruise, from Amsterdam to Bucharest. We picked this one and signed up early so that Alice could have a bathtub; she doesn’t take showers, and I don’t take baths. But we’re very compatible, and surprisingly clean.

In January I begin rehearsals for seven March performances of Guys and Dolls, my fourth musical since 2014, as the bad guy (and non-singer) Lieutenant Brannigan of the NYPD. I'm also the off-stage voice of garage owner Joey Biltmore, and voice him with a New York whine I learned from watching old Warner Brothers movies. My third role, in disguise with a false mustache, is as one of the gambling gangsters in the Luck be a Lady scene. I keep trying to enlist Alice for a play – she’s a natural actress – but she balks at all the memorization and time-killing rehearsals.

The business Alice founded, Vulcan Wire, had its Christmas Party in San Leandro again this year hosted by CEO Mike Graffio, not far from its office and manufacturing buildings in Hayward. 


Alice and I are as busy in retirement as in our working days, and loving almost every minute. Travelling, writing, visiting friends and family (not as much as we would like), walking to Cook’s Beach and playing ball with Radar every day. Our motto: someone has to live a life like this; it might as well be us.


 Radar looks like he's wearing an hydrangea hat!


Thursday, November 09, 2017

Climate Change Alarmist Science is Wrong


Timing is everything, and as hurricanes and wildfires rage some of my friends ask, “Have you changed your mind about climate change?” My firm answer, “No!” They ask me because I’m the most notorious made-made global warming/climate change/weather weirding skeptic in the Gualala/Sea Ranch/Point Arena area. And totally unknown elsewhere, including on the payrolls of any fossil fuel companies. I’m called a climate change denier, an odious Holocaust-tinged label, so I respond calling alarmists natural climate-change deniers or ignoratti (look it up), and science is on my side.

I’ve had an open challenge to debate that climate change is natural for over fifteen years, with no takers.

Hurricanes? The just-ended twelve years of no Category 3 to 5 hurricane landfalls in the United States was unprecedented.  Gaye LeBaron’s column in the October 14 Press Democrat reminded us of the deadly 1964 wildfires in Sonoma County, less catastrophic only because much less was at risk in the fire’s path than now.
Wildfires? The past 100 years have been among the wettest of the past 7,000 in California.

Sea level rise? According to innumerable reports in the Press Democrat, San Francisco Chronicle, and other sources, the rate of sea level rise is accelerating with a predicted increase of five feet or more by 2100, or at least 18 millimeters per year, beginning today (A penny is about a millimeter thick).  Unfortunately for the alarmists, accelerating sea level rise is easy to disprove, courtesy of the online Permanent Service for Mean Sea Level (PSMSL.org, which displays all the World’s tide gauge records), and the National Oceanic and Atmospheric Agency (NOAA) tides and currents website.

Of local interest, San Francisco’s tide gauge, installed 1854, has the longest record in the Western Hemisphere. From 1854 through 2016, San Francisco sea level rose 174 millimeters (4.25 inches per century), or 1.08 millimeters per year with no acceleration. In fact, San Francisco’s sea level was highest in 1983, almost four inches above the 2016 level. Most other West Coast cities also had their highest sea levels in 1983.

 Even after the NOAA tortured the above sea level rise data - note the unexplained "Apparent datum shift" -  the rate of rise for San Francisco per the above graph (1.94 mm per year) is less than 8 inches per century, and shows no sign of acceleration.

Coincidentally, NOAA keeps records on 199 tide gauges active throughout the past century, and their average sea level rate of rise is also 1.08 mm/year. It’s easy to look at the NOAA tide gauge records online; almost all approximate a straight line with annual rates of rise far below alarmist predictions.

Here is link to a blog post showing 25 tide gauge records scattered across the Pacific. None come close to the NASA satellite measurements claimed below. (Click on the link to see the tide gauge information)

NASA satellite sea level measurements claim a rate of rise of 3.2 mm/year (thirteen inches per century – still far from five feet), but their margin of measurement error is forty to fifty times greater than tide gauge averages.

News media also constantly bombard us with reports that global temperatures are the highest in recorded history – which means in the past 200 years after thermometers came into use. Catastrophic anthropogenic global warming (CAGW) alarmists are broadly ignorant of the natural climate changes during the past 2.6 million years, and even of the four periods warmer than now during the past 10,000 years. According to Greenland ice core and widespread sediment core studies, we now live in the coldest 1,000 of the past 10,000 years.

All about us the Earth gives evidence of previous warmer periods. On recent trips with my wife, Alice, to Antarctica, the Arctic, Iceland, Thailand, and Cuba, I saw ancient coral mounts, and beaches and drift wood, many feet above the highest tides level. A map of Glacier Bay, Alaska, disclosed glacier retreat in the 1800s ten times greater than in the 1900s.

Tree lines were over 100 miles further north in Europe, Asia, and Canada 6,000 years ago, and in the Alps tree lines were several hundred feet higher. Also in the Alps and Greenland, retreating glaciers are uncovering artifacts of human occupation during preceding warmer periods.

Of more local interest, Santa Rosa company Remote Sensing Systems produced a global temperature record of the near two-decade “pause” in warming, which they now claim was erroneous. The pause was broken by last year’s strong El Nino, which is not associated with increased atmospheric CO2.


Since 30% of all human-produced CO2 emissions occurred after 2000, the lack of increased warming associated with increased CO2 predicted by climate models shatters the CO2-drives-global-warming hypothesis. As Sherlock Holmes, and legendary physicist Dr. Richard Feynman said (paraphrased): “The most beautiful hypothesis can be destroyed by one ugly fact.”

30% of all human-produced CO2 emissions occurred after 2000

And more “ugly” facts abound. Al Gore’s An Inconvenient Truth featured a 400,000-year Antarctic ice core study he claimed proved increased atmospheric CO2 drove higher temperature, but proved the opposite. The study showed that increased CO2 lagged, not led, the temperature increases by hundreds of years. As we learned in basic physics, warming water expels CO2 to the atmosphere; cooling water absorbs it.

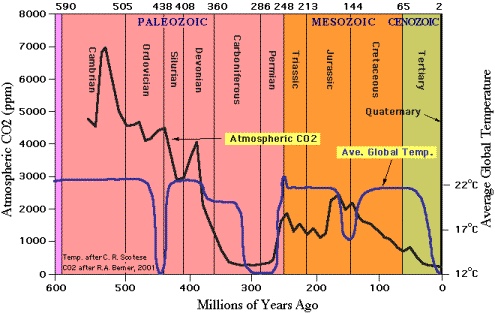
In the past millions of years, atmospheric CO2 was ten to twenty times the current level, and there was no runaway warming. On the contrary, cooling began each time CO2 was at a peak.


Rather than CO2, the cycles of 100,000-year glacial periods alternating with 15,000-year interglacials (like our Holocene), correlate closely with orbital variations, and not at all with CO2.

Also of local interest, NASA Goddard Institute of Space Studies produces charts of surface temperatures for U. S. cities. Santa Rosa and Ukiah charts began around 1900 and showed pronounced cooling trends until 2012.  Then NASA recast the charts and early years were “cooled”, replacing cooling trends with warming.

Before 
After

A word I learned during my year at Santa Rosa Junior College, 1961/62, sums this up perfectly. It’s Kafkaesque; a world turned on its head, where unsupported beliefs inspire worship, and skeptics armed with facts are suppressed and ridiculed.


“Climate change; it’s what climate does, naturally”

Friday, June 16, 2017

Pacific Tide Gauge Charts Show No Acceleration in Sea Level Rise

Californians are constantly bombarded with apocalyptic articles on sea level rise. A reporter, Sarah J. Black, for our local weekly newspaper, the Independent Coast Observer, had a very long article, "Studies show climate change could transform Mendonoma (Mendocino and Sonoma counties)," in their June 9, 2017 issue. In a section on sea levels, the ICO averred that: "The 20th Century saw sea levels rise at 1.2 to 1.7 mm per year, and those rates doubled after 1990, 'and the rise continues to accelerate,' researchers found."

"Currently rates are at 3.4 mm per year,' greater than anytime over the past thousand years,' the report reads."

Concerning the 3.4mm/year,  I had previously looked at 108 tide gauge records worldwide, and found a mean of 0.9mm/year and median of 1.1mm/year. Seventy-three of the records were at 1.8mm/year or less, and only 10 at 3.4mm/year or more. The average length of each tide gauge record was 90 years.

Besides my study using readily available resources open to all on the internet, a Hebrew University of Jerusalem study (https://tinyurl.com/y8u9983s) found mean sea levels rising by 1mm/year. For 35 percent of tide gauges, sea levels rose on average by 3.8mm/year. However, sea levels were stable for 61 percent of tide gauges, and fell on average by almost 6mm/year for 4 percent of tide gauges.


NOAA keeps records on 199 tide gauges which have been active this century. The average sea level rise rate is 1.08 mm/year for that set of gauges – one third of the claimed University of Colorado 3.2mm/year trend. Eighty-six percent of the tide gauges show sea level rise slower than 3.2mm/year.

Sea level, according to the GRACE gravitational anomaly satellites, has been falling (Peltier et al., 2009). During the eight years of ENVISAT’s operation, from 2004-2012, sea level rose at a not very scary 1.3 inches per century, or 0.33 mm/year.

Nicola Scafetta of Duke University found that sea level is subject to 60-year cycles and concludes that the human impact on sea level is too small and is statistically insignificant.

Another study found primarily that unsustainable groundwater use contributed a sea-level rise of about 0.77mm /year between 1961 and 2003.

Armed with all these studies, including the US government NOAA one, showing sea level rise at a rate less than a third of the rate posited in the ICO, I then decided to look for signs of acceleration in rates. Again, the NOAA provided convincing proof that they were not in the form of tide gauge graphs for cities worldwide. I selected twenty-five tide gauges scattered over the pacific, and found only two that had rates higher than 3.4mm/year. 

I have posted all twenty-five charts below for two purposes. One: each chart shows the rate of sea level rise in mm per year for its location. Two: you can visually determine for each chart if there is a doubling of the rate after 1990, as claimed in the report cited by the ICO. There is none. If you doubt this, look closely at each straight line fitted to the observations. A doubling after 1990 would appear as a cluster of observations above the line, not as observations both above and below the line.

The San Francisco chart below is interesting at several levels. It is the longest tide gauge record in the Western Hemisphere, began in 1854. Its highest level was third-four years ago in 1983, over two inches higher than in 2015, and 2016 is lower than 2015. Does it look like the rate of sea level rise doubled after 1990?